Just like the world around us, the world of digital marketing is constantly evolving. Marketing strategies change as often as marketing trends and it is our responsibility as marketers to keep up the pace.
In 2022, the wealth of information available to those who are paying close enough attention is abundant. How can you make sure that you keep your business at the forefront of any technological advances, developments in strategy, and overall marketing trends?
One way to make sure you are ensuring your company reaches its potential is to turn to statistics. Digital marketing statistics give us great insight into market behaviors.
Regardless of your focus, there is knowledge to be gained by reading the statistics. By comparing digital marketing statistics from the last number of years, we can identify what has happened and, importantly, more accurately predict what is going to happen.
Social Media Marketing Statistics for 2022
Social media marketing is one of the jewels in the crown of digital marketing. What do we know about the various social media platforms that can help us with our marketing efforts? Here are some of the most important stats you need to know, about some of the world’s most popular social media platforms.
Social Media Usage Statistics:
- Today there are over 4.74 billion social media users. (Hootsuite)
- There are 5.29 billion unique mobile users. (Statusbrew)
- 75.9% of people aged 13+ use social media. (Hootsuite)
- The average daily usage of social media is 2 hours and 29 minutes. (Smart Insights)
- The average person uses 7.4 social media platforms per month. (Smart Insights)
- 16-24-year-old women use social media the most, averaging 3 hours and 18 minutes per day. (Hootsuite)
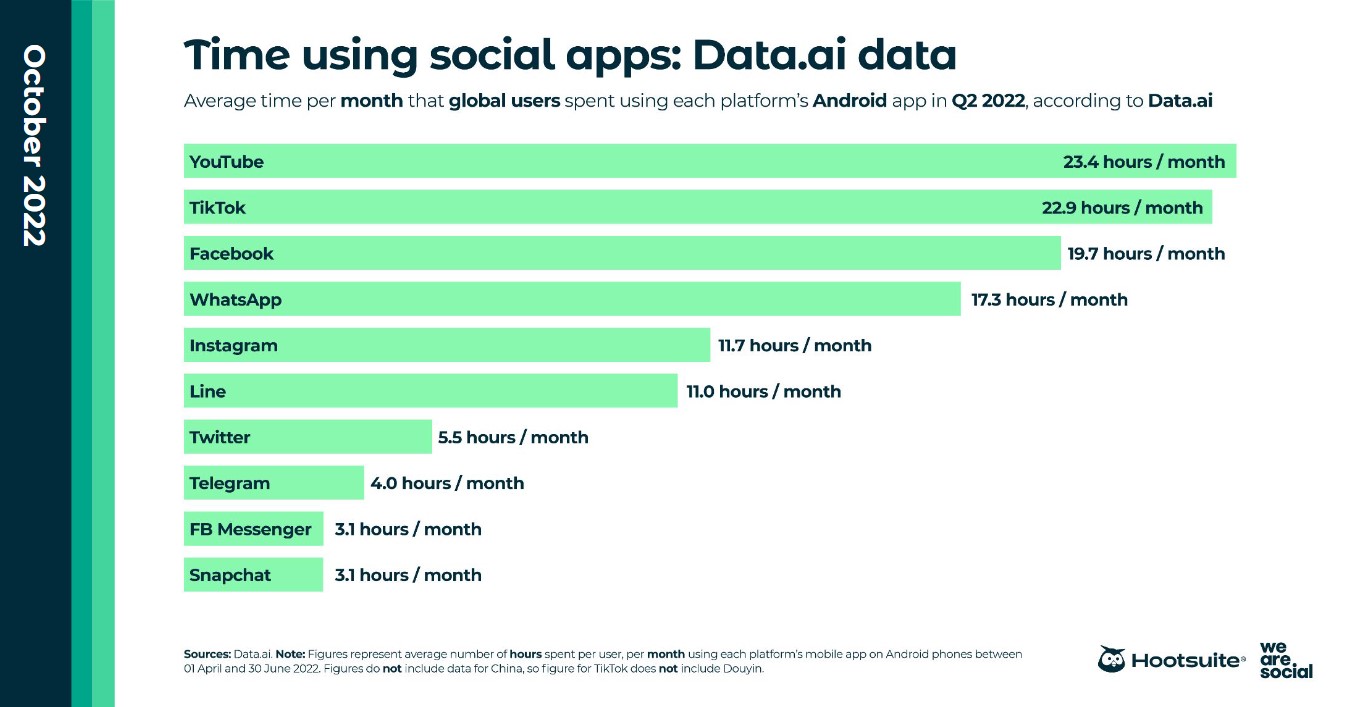
- YouTube remains the most daily used social media in Q2 2022. (Hootsuite)
These figures alone should give you an idea of the marketing potential of social media, but here are some more key stats to know.
 Source: Data.ai
Social Media Advertising Statistics:
- Ad spending on social media will pass $173 million in 2022. (Statista)
- Relative to Q3 2021, Q3 2022 has a 12% increase in social spending. (Hootsuite)
- Annual social media advertising spending will increase an estimated 17% from the previous year. (Hootsuite)
- Shoppable images and videos push consumers towards completing a purchase the most, accounting for 24% of all respondents. (Insider Intelligence)
- Next comes video advertising with 16.3%. (Insider Intelligence)
- Posts and sponsored posts from brands come next at 13.4% and 9%, respectively. (Insider Intelligence)
During the pandemic, social media trends changed quite drastically. Here are some of the most important changes in social media trends we witnessed during the pandemic:
- 43% of internet users aged 16-64 spent more time on social media. (Smart Insights)
- 42% spent longer on messenger services. (Smart Insights)
- 36% spent more time on mobile apps. (Smart Insights)
- 16% created and uploaded more videos (Smart Insights)
The most popular social media sites each offer something unique to consumers. Facebook, Youtube, TikTok, and Instagram have become the most popular social media platforms in the world.
Some of the statistics behind these sites are mind-blowing!
Source: Statista
Facebook Users
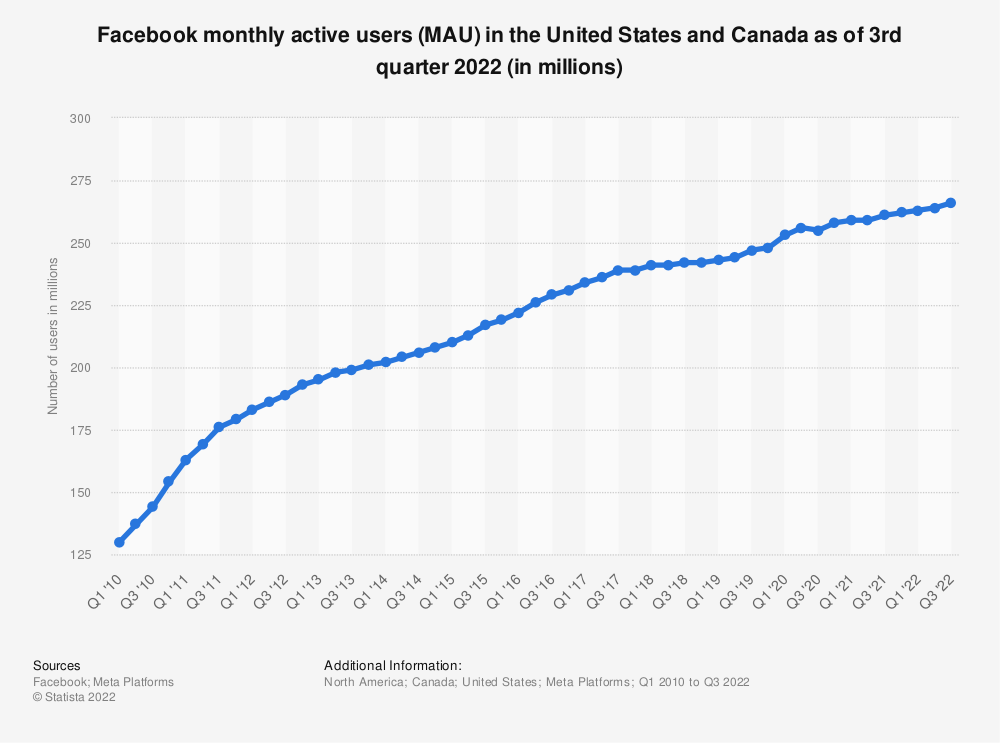
- Facebook is the oldest of the social media giants, but it remains the most popular, with 2.93 billion monthly active users, that’s up 1.3% from last year. (Hootsuite)
- Two-thirds of Facebook users log on daily. (Hootsuite)
- Almost 60% of the world’s internet users log into Facebook each month. (Hootsuite)
Facebook Demographics
- India has the most Facebook users, with 349 million. (Hootsuite)
- The US has 194 million users on Facebook. (Hootsuite)
- The equivalent of 36% of the world’s population has a Facebook account. (Statista)
- 43.5% of users are female, while men make up the majority, at 56.5%. (Statista)
- One in 5 Facebook users is a male aged 24-35. (Statista)
- In the US, there are more female Facebook users aged 25-34 than any other grouping. (Statista)
Facebook Usage
- People spend around 20 hours each month on Facebook. (Hootsuite)
- The average US user is on Facebook for just under 35 minutes per day. (Hootsuite)
- Less than 1% of users use Facebook alone and no other social media platforms. (Hootsuite)
- Half of all Facebook users also use Twitter. (Hootsuite)
Facebook – The Brand
- Facebook is the 7th most valuable brand worldwide, valued at $101.2 billion. (Statista)
- Facebook generated a $39.3 billion net profit in 2021. (Business of Apps)
- One in three Facebook users purchase on the platform. (Insider Intelligence)
- Two in three Facebook users visit local business pages each week. (Meta)
YOUTUBE
YouTube Users
- The most popular channels on YouTube draw up to 3.5 billion monthly views. (Statista)
- Over 1-in-3 Americans visit YouTube multiple times per day. (Pew Research Center)
- 99% of the time, YouTube is being used in parallel to another, or multiple, social media platforms. (Hootsuite)
YouTube Demographics
- 81% of people in the US use YouTube. (Pew Research Center)
- India has the most YouTube users in the world with 467 million. (Statista)
- 4 in every 5 parents say their child/children under the age of 11 watches YouTube. (Pew Research Center)
- The male/female split of YouTube viewers comes out at 54% men and 46% women. (Hootsuite)
- Indonesia, Brazil, Russia, and Japan all have over 100 million YouTube users. (Statista)
YouTube Usage
- Of all social media platforms, people spend the most time on YouTube, with the average user amassing 23.7 hours per month on the site. (Hootsuite)
- YouTube is second only to Facebook in social media platform popularity. (Statista)
- Sports viewership on YouTube is expected to reach 90 million by 2025. (Think With Google)
- YouTube Shorts have amassed over 5 trillion views. (YouTube Official Blog)
- Mobile users visit twice the number of YouTube pages as desktop users. (Statista)
YouTube Brands
- YouTube’s worldwide advertising revenues for the second quarter of 2022 were $7.34 billion. (Statista)
- 70% of viewers bought from a brand after seeing it on YouTube. (Google Ads)
- YouTube’s total user count could reach 2.56 billion in the near future. (Hootsuite)
- Intent-driven targeted ads cause a 100% lift in purchase intent when compared to demographic targeting. (Think With Google)
- YouTube’s advertising audience grew 9.6% since last year. (Hootsuite)
TIKTOK
TikTok Users
- TikTok was the fastest new social network to reach 1 billion monthly active users, reaching the milestone in just over 5 years. (Statista)
- The number of TikTok users in the US is expected to grow to just under 90 million by 2023. (Statista)
- The average TikTok user spends 19.6 hours per month on the platform. (Hootsuite)
TikTok Demographics
- 1-in-5 Americans use TikTok. (Insider Intelligence)
- As of January 2022, Saudi Arabia, UAE, and Kuwait had the largest national TikTok reach in the world, reaching 87.9%, 81.3%, and 75.4% of their populations, respectively. (Statista)
- 61% of TikTok users are female. (Statista)
- 36% of adults in the US have a favorable opinion of TikTok. (Statista)
TikTok Usage
- The average US TikTok user is on the app for 32.8 minutes per day. (Vox)
- The US population’s overall feeling towards TikTok online is positive, at about a 57% positive sentiment. (Vox)
- On iOS devices, Colombia saw the highest growth in TikTok downloads in Q2 of 2022, at 59.4%. (Statista)
- Venezuela, Sri Lanka, Kenya, and Mexico also saw an increase of over 20% on iOS devices during the same period. (Statista)
- On Android, however, during Q2 of 2022, the countries with the highest growth in TikTok downloads experienced decreased downloads. (Statista)
- The countries in which download numbers shrunk the least were the Netherlands, Colombia, and the USA, at -4.6%, -15.2%, and -16.5%, respectively. (Statista)
TikTok Brands
- TikTok was the 20th most valuable technology brand in the world in 2021. (Statista)
- Over 63% of all videos with the highest CTR highlight their key message or product within the first 3 seconds. (9 Creative Tips | Auction Ads on TikTok)
- Shooting vertical TikTok videos give you a 25% higher watch-through rate. (9 Creative Tips | Auction Ads on TikTok)
Instagram Users
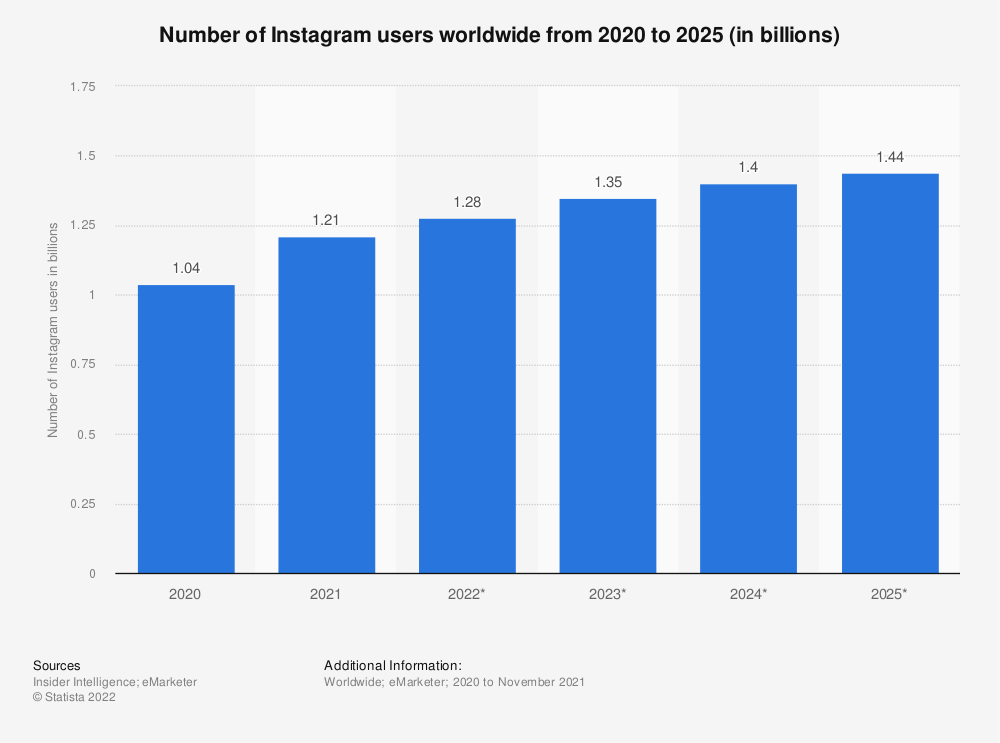
- It is estimated that by 2025, Instagram will have almost 1.5 billion users. (Statista)
- 50% of Instagram users admit to clicking on a brand’s website after viewing one of their stories. (Instagram)
- The average user is on Instagram for 11.2 hours per month. (Hootsuite)
Instagram Demographics
- Instagram is the most popular social media website with Gen-Z. (Statista)
- 25-34-year-olds are the platform’s most frequent visitors. (Statista)
- Almost as many women use Instagram as men, with 51.6% of users male, and the remaining 48.4% female. (Statista)
- Turkish people use Instagram for the longest time, clocking 20.2 hours per month on average. (Hootsuite)
- South Koreans, on the other hand, are on Instagram for just 5.8 hours per month. (Hootsuite)
Instagram Usage
- Over 90% of users watch videos on Instagram each week. (Meta)
- Just under 60% of all US-based adults use Instagram every day. (Pew Research Center)
- Instagram ads are most likely to reach the 18-34-year-old group. (Meta)
- 92% of users claim to have acted instantaneously after seeing a product advertised on Instagram. (Meta)
Instagram Brands
- Instagram is the second-best-performing social media platform for advertisers. (Hubspot)
- Ads on Instagram reach almost one-third of all internet users. (Hootsuite)
- Two-thirds of people say Instagram connects them with a brand. (Meta)
-
As well as this, 50% of respondents are most interested in a brand after seeing it on Instagram. (Meta)
-
Source: Statista
SNAPCHAT
Snapchat Users
- 23% of US adults use Snapchat. (Intelligence Insider)
- Snapchat has over 300 million daily active users. (Snapchat)
- The average user spends 3 hours per month on Snapchat. (Hootsuite)
Snapchat Demographics
- India has the most Snapchat users worldwide, with 144 million. (Statista)
- Next comes the US in a clear 2nd place at 107 million users. (Statista)
- France, Pakistan, and the UK come next, all boasting between 20 and 25 million users. (Statista)
- Females are more prevalent than males on Snapchat, with women and girls accounting for 52.9% of the audience. (Statista)
- Gen-Z has favored Instagram and Tiktok over Snapchat, in recent years. (Statista)
Snapchat Usage
- In 2022, people spend 7 minutes per day on Snapchat, on average. (Insider Intelligence)
- On New Year’s Eve 2021, Snapchat launched special lenses for the event and they generated over 7 billion impressions. (Snapchat)
Snapchat Brands
- Snapchat’s revenue boomed in Q4 of 2021, generating $1.5 billion in that quarter alone. (Business of Apps)
- The minimum advertising budget on Snapchat is just $5. (Snapchat for Business)
- Snapchat holds about $4.4 trillion in spending power. (Snapchat for Business)
- Of Snapchat’s Discover Partners, 25 of them managed to reach at least 50 million unique platform users. (Snapchat)
LinkedIn Users
- 1-in-4 US adults use LinkedIn. (Insider Intelligence)
- The platform boasts over 810 million users. (LinkedIn Pressroom)
- There are over 58 million companies listed on the site. (LinkedIn Pressroom)
- 6 people get hired every minute on LinkedIn. (LinkedIn Pressroom)
LinkedIn Demographics
- Over 200 million people from each of North America, Europe, and Asia-Pacific use LinkedIn. (LinkedIn Pressroom)
- LinkedIn misses the mark with Hungarians, with only about 1 million users in Hungary. (LinkedIn Pressroom)
- In the United States alone, there are over 191 million LinkedIn profiles. (LinkedIn Pressroom)
LinkedIn Usage
- 6 people get hired every minute on LinkedIn. (LinkedIn Pressroom)
- 95 job applications are submitted per second. (LinkedIn Pressroom)
- 50 million people use LinkedIn each week to search for jobs. (LinkedIn Pressroom)
LinkedIn Brands
- LinkedIn is the 7th fastest-growing brand in 2022. (Statista)
- LinkedIn had a 26% year-over-year growth in revenue in Q4 of 2022. (LinkedIn Pressroom)
- Google, Amazon, TED, Forbes, and Microsoft are the most followed brands on LinkedIn in 2022. (Hootsuite)
Influencer Marketing Statistics for 2022
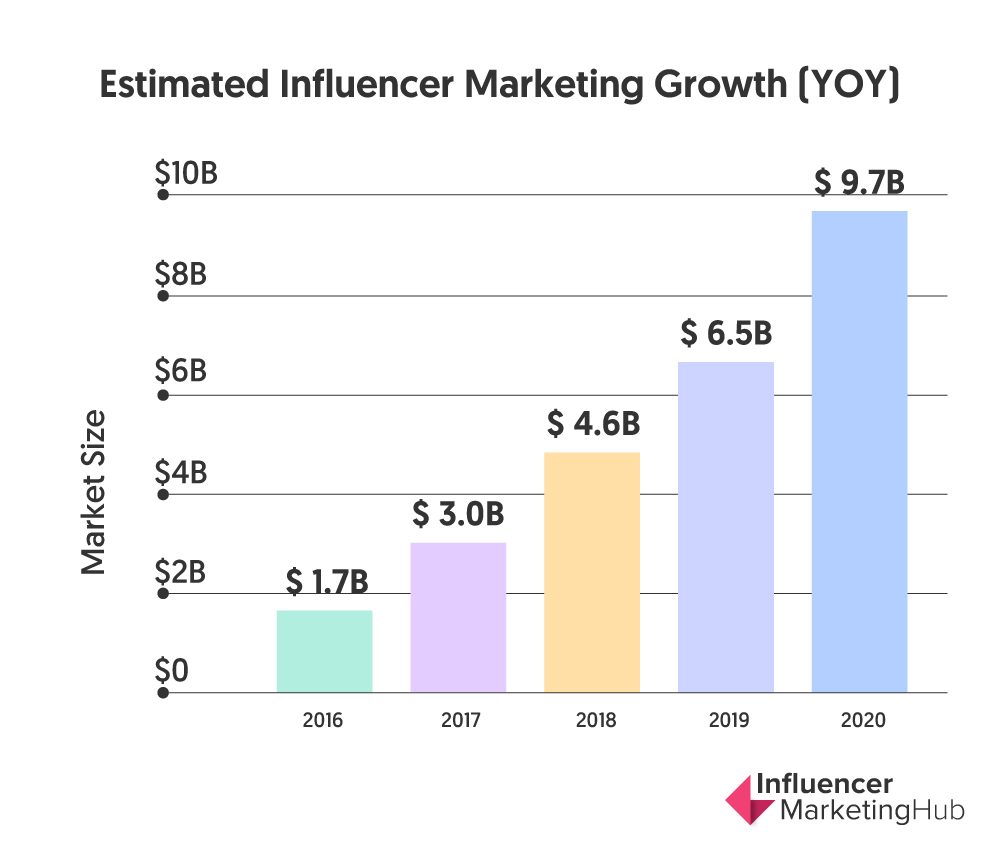
Influencer marketing is one of the newest marketing tools available in 2022. Combining the idea of celebrity marketing with the modern-day marketplace of social media, influencer marketing has been remarkably successful in recent years.
Influencer Marketing Statistics:
- 1 in 10 marketers say their influencer posts are their most popular in terms of engagement. (Hubspot)
- About $8 billion is spent on Instagram Influencers each year. (Statista)
- The number of people who bought products because celebrities or influencers advertised them has grown across the world. (Statista)
- Over 4 in 10 internet users have some form of an ad blocker. Influencer relationships bypass this roadblock. (Backlinko)
- Over 90% of influencers worldwide utilize Instagram. (Influencer Marketing Hub)
- Influencer marketing is expected to be valued at $15 billion by the end of 2022. (Business Insider)
- There are over 660 million influencers working with companies each year. (Influencer Marketing Hub)
- TikTok influencers get the highest engagement rate of influencers across the major social media channels. (Influencer Marketing Hub)
Influencer Marketing Brands and Brand Mention Statistics:
- Instagram is the preferred platform for brands using influencer marketing.(Influencer Marketing Hub)
- Zara was the most mentioned brand on Instagram. (Influencer Marketing Hub)
- Netflix was the most mentioned brand on TikTok. (Influencer Marketing Hub)
- Steam was the most mentioned brand on YouTube. (Influencer Marketing Hub)
- Brands spend about $174 per piece of influencer content. (Collabstr)
- Brands are expected to increase their Influencer Marketing Budgets this year (Influencer Marketing Hub)
Account-based Marketing Statistics for 2022
Account-based marketing is a highly targeted marketing strategy deployed by companies who want to weed through what are found to be less lucrative potential customers, and wish to target higher-value accounts instead. Identifying these high-value accounts, and personalizing the customer experience, account-based marketing can help boost ROI and customer loyalty.
Here are some of the latest account-based marketing statistics for 2022:
- 67% of brands employ ACM strategies. (Hubspot)
- Companies dedicate 2(% of their marketing budget to ABM, on average. (Spice Works)
- ACM was up 15% to 70% in 2021 when compared to 2020 (50%). (Hubspot)
- Only 17% of marketers have a mature ABM marketing strategy. (ITSMA)
- Companies implementing account-based marketing strategies have seen up to 208% growth in their market revenue. (MarketingProfs)
- 94% of B2B marketers use ABM. (Terminus)
- 55% of ABM users tailor content to target accounts in specific roles. (Spice Works)
- Advanced data management is key to successful ABM, according to 43% of marketers. (Similar Web)
Audience Marketing Statistics for 2022
Audience marketing is another highly targeted marketing ploy. By fusing the behaviors, views, and attitudes of buyers, you have moved beyond simple demographic targeting. Audience marketing allows you to properly explore how buyers think and act.
Here are the all-important audience marketing statistics for 2022:
- There’s been a 36% increase in the number of Americans doing the majority of their household and grocery shopping online. (GWI Commerce Report)
- Gen Z online shoppers prioritize content that is lighthearted and funny, inspirational, or informational and helpful. (GWI Gen Z Report)
- A quarter of B2B organizations allocate only 5% of their total budget to marketing. (Statista)
- 41% of B2B businesses conduct their marketing activities in-house (Statista)
- Spending on 3rd-party audience data has ground year-on-year in the US. (Statista)
- 45% of Pinterest users have a household income of over $100,000. (Pinterest)
- Creating buyer personas will help marketers understand their target audience much better. (Hubspot)
SEO Statistics for 2022
In 2022, the importance of SEO for marketers is well-known. By using SEO effectively, companies can ensure that their product or service appears higher in search engine results. When used correctly, SEO is one of the best ways to attract new customers.
Check out these statistics that show just how important SEO has become:
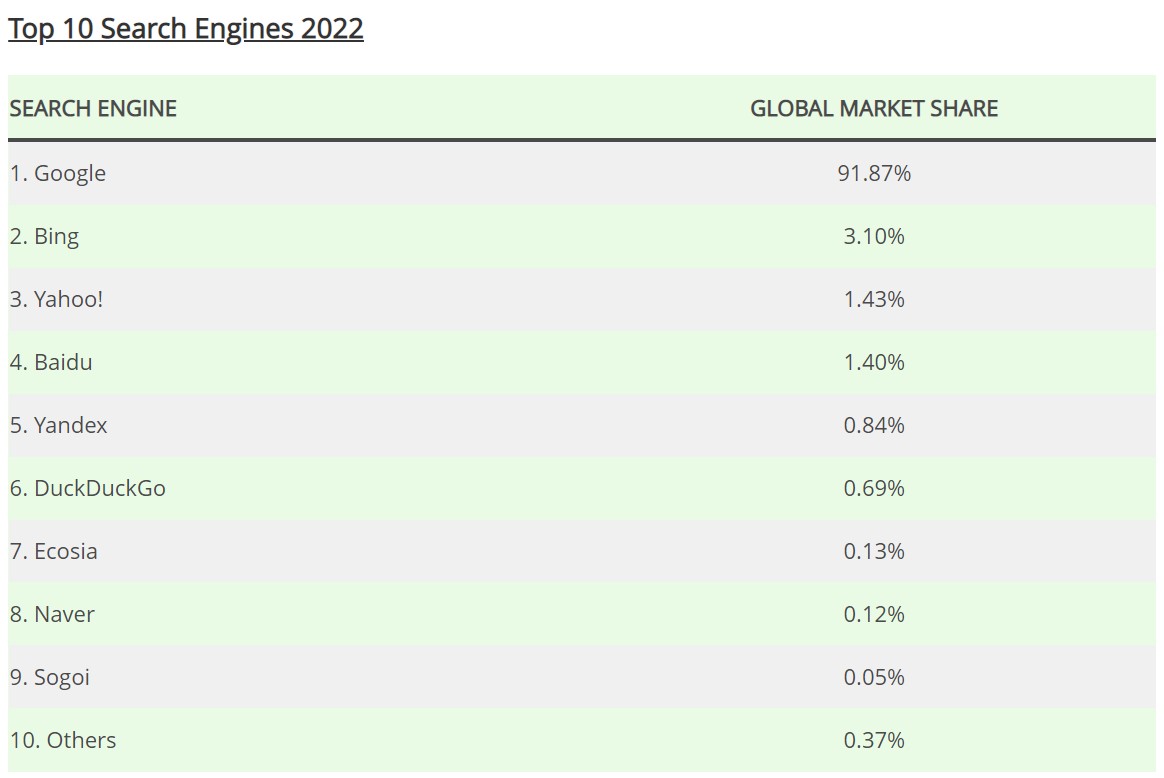
- The search engine market share worldwide is mainly dominated by Google, owning 92.42%. (StatCounter)
- Organic searches from Google account for 43% of all eCommerce traffic. (The Global Statistics)
- For 2022, search spending advertising in the US is projected at $95.2 billion. (Statista)
- 62% of marketers worldwide consider SEO and search algorithms crucial in 2022. (Statista)
- 70% of digital marketers consider SEO better than PPC for generating sales. (Hubspot)
- In 2022, Google processed over 12.5 million search queries in the US alone. (Statista)
- The top three organic search results on the Google Search page account for 54.4% of all clicks. (Backlinko)
- Title tags between 40 and 60 characters have the best organic clickthrough rate (CTR). (Backlinko)
- Google Analytics and Google Search Console are the most used tools in 2022 to quantify data in an SEO report. (Databox)
- 80% of companies use paid SEO tools. (Databox)
10 PPC Statistics for 2022
Pay-per-Click marketing involves displaying paid advertisements at the top of search engine results pages. PPC is highly testable and alterable, and extremely popular. PPC hits a wide audience at a very cost-effective rate.
Here are some important PCC marketing stats for 2022:
- Between 2019 and 2024, US digital ad spending will grow from 132 to 279 billion dollars, representing 53% of global digital ad spending. (Statista)
- In 2022, mobile advertising revenue in the US is expected to grow by 15.2%. (Statista)
- Full-screen video ads are considered the most effective way to acquire new app users. (Statista)
- The US median cost-per-click (CPC) in Google Ads search advertising stands at $2.61. (Statista)
- 80% of brands use paid social media advertising. (Hubspot)
- In 2022, advertisers in the US are expected to spend almost $106 billion on programmatic digital display advertising. (Statista)
- Google will generate almost $357 billion in advertising revenue by 2026. (Statista)
- 17% of global online buyers spend money in e-grocers and supermarkets. (Statista)
- 54% of US shoppers bought an item online because it could be delivered straight to their homes. (Statista)
- 70% of consumers in the US receive mistargeted ads at least once a month. (Statista)
10 Mobile Statistics for 2022
The one device that almost all of us have these days is the mobile phone. Needless to say, advertisers should be interested in the possible earnings from billions of faces staring at billions of screens each day. Mobile advertising is cost-effective, quick, and mobile ads can run 24/7. Perhaps most importantly, mobile advertising can be delivered in real time.
Let’s see what other statistics we’ve got on mobile advertising in 2022:
- Mobile devices generate 58.99% of all global website traffic. (Statista)
- By 2024, global mobile advertising spending is projected at $495 billion. (Statista)
- There are over six billion smartphone subscriptions worldwide. (Statista)
- WhatsApp is the most popular mobile messaging app worldwide, with more than 2 billion monthly users. (Statista)
- In 2022, the number of mobile users is expected to reach 7.26 billion. (Statista)
- Google Play had 55.3 billion downloads from mobile users in the first half of 2022, while the Apple App Store registered 16 billion mobile downloads. (Statista)
- The average value of US online orders placed from smartphones is $112. (Statista)
- 40% of global Instagram users engage with the mobile app daily. (Statista)
- 72% of all internet users will exclusively use mobile devices by 2025. (Bankmycell)
-
92% of worldwide users accessed the internet through a mobile device in 2022. (Statista)

Source: The Global Statistics
Content Marketing Statistics for 2022
Focused on the creation and distribution of high-quality content, content marketing is an essential tool in a marketer’s toolbelt. Content is key to several other areas of marketing, such as SEO and PPC, but it is also a powerful weapon in its own right.
Check out our top content marketing statistics for 2022 right here:
- 59% of digital marketers consider video as their preferred media format. (Hubspot)
- 69% of B2B marketers worldwide would invest in video content marketing. (Statista)
- The global content marketing industry revenue for 2022 is projected at $76 billion, continuing to grow to $137 billion by 2026. (Statista)
- 50% of marketers in the US hired content creators to produce educational content. (Statista)
- Marketing executives worldwide consider brand engagement the most effective use of content-led advertising. (Statista)
- 84% of consumers in the US stated that they were more likely to trust brands if they included user-generated content in their marketing initiatives. (Statista)
- 69% of B2B marketers worldwide said they would invest in video marketing in 2022. (Statista)
- 64% of marketers are interested in 2022 to invest more in interactive content (polls, augmented reality, etc.). (Hubspot)
- 80% of marketers consider funny content as being the most effective type of content used on social media. (Hubspot)
Within content creation, one of the most traditional, yet continuously, demonstrably vital aspects of a company’s marketing efforts is blogging. Great content stands the test of time.
Blogging Statistics for 2022
- Blogs with a video can increase organic search results by 157%. (Omnicore)
- Blogs with images can boost views by 94%. (Omnicore)
- It is recommended that marketers produce 16 blogs per month.
- Just 9% of companies had a formal editor for their blogs. (Orbit Media)
- A company’s inbound link total can increase by up to 97% by simply having a blog. (Hubspot)
Video Marketing Statistics for 2022
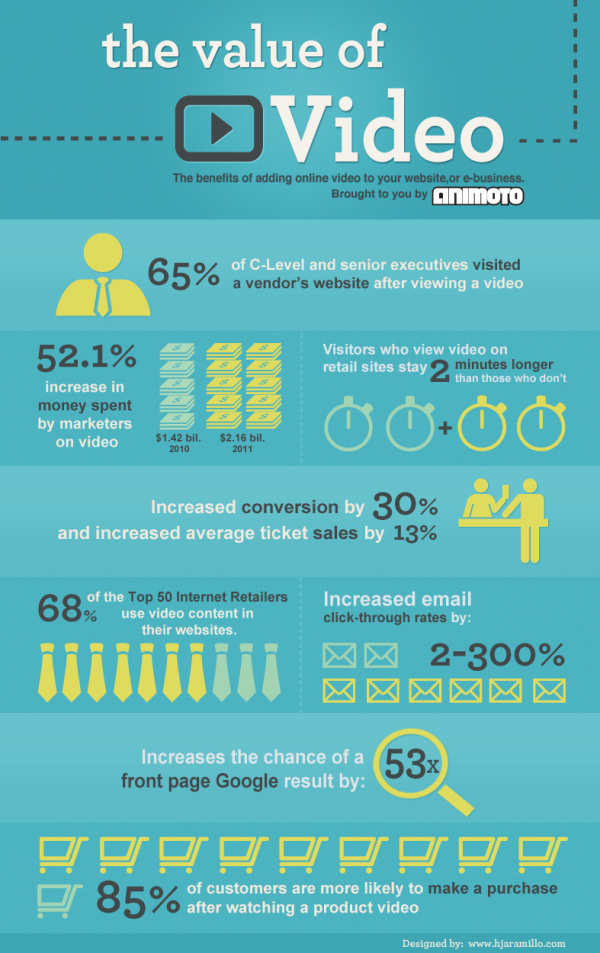
Internet users are shown to spend more time on websites and engage more with those websites when there is video content present in 2022. Videos help build relationships with consumers, allowing them to put faces to names, and familiarize themselves with brands and logos. Videos can quickly explain things that would take all day to write out.
Source: ImageWorks.
Here’s why video marketing can’t be ignored in 2022:
- YouTube is the most used platform for video content. (Hubspot)
- 35% of marketers plan to use video format for the first time in 2022. (Hubspot)
- 24% of marketers will use TikTok for the first time in 2022. (Hubspot)
- 53% of marketers optimize their video content for visual search engines. (Hubspot)
- Short-form videos provide the best ROI compared to other formats. (Hubspot)
- 65% of marketers worldwide use videos on Facebook for marketing purposes. (Statista)
- One-third of marketers worldwide plan to invest the most in video marketing. (Hubspot)
- 33% of video marketers worldwide consider revenue growth and sales as their primary marketing goal for 2022. (Statista)
- 51% of marketers plan to invest more in short-form video content. (Hubspot)
- 72.4% of companies want to create new types of video content, including original branded series. (Hubspot)
Latest Email Marketing Statistics for 2022
Nowadays, email marketing is one of the more traditional marketing strategies used by companies and individuals alike. Of course, that does not mean it’s outdated. Email is an open platform and it is most people’s chosen form of digital communication.
Here are the statistics you need to know before your next email marketing campaign:
- The top three best email clients are Apple, Gmail, and Outlook. (Hubspot)
- 27% of consumers in the US stated that it was very likely that a brand’s newsletter would influence them to purchase products. (Statista)
- In 2022, 52% of email opens worldwide went through Apple Mail Privacy Protection services. (Statista)
- Email marketing continues to be the most effective online marketing tactic, with 45% of e-shoppers being influenced by it. (Statista)
- Over 68% of US consumers prefer to be contacted by brands via email. (Statista)
- Worldwide, email users are projected to grow to 4.6 billion in 2025. (Statista)
- Email marketing delivers a $36 return for every $1 spent. (Hubspot)
- 79% of marketers ranked email in their top three channels for effectiveness. (Hubspot)
- 40% of US millennials stated that a brand’s regular email newsletter would influence them to buy a product. (Statista)
- In 2021, an estimated 319.6 billion emails were sent and received worldwide daily. The number is projected to increase to 376.4 billion by 2025. (Statista)

